
Introduction
Snapping intensifies… After elementary Resorce Allocation Studies done in a human and machine way, as well as a short analysis on how Marvel Snap game is won in the last turn in the world of vanilla power (‘Endgame Or The Last Turn‘), we arrive onto the fields of the Energy Curve.
Energy Curve is the profile of Marvel Snap deck with respect to energy cost of its cards. Optimal proportion between low and high cost cards give the deck a good flow. Builds with reasonable shape of energy curve are able to spend resources efficiently. Using all energy available in a turn is called playing on curve.
In this article we would investigate the topic of mana curve at a general level and then move to numerical computation. The results include efficiency data for an ultimate set of possible curves. Let’s seek perfection together.
Energy (Mana) Curve
The deck in Marvel Snap always consists of no less and no more than 12 cards. The energy cost of cards but for few exceptions is contained in 1-6 range. There is no constraints but the common sense when it comes to the number of cards at the given cost.
A normal game of Marvel Snap lasts 6 turns and the amount of energy available to spend to play cards during each turn is simply equal to turn number; i.e. at turn 3 there are 3 energy units available and so on. What is the total energy to harness during the game?
\[E_{max} = \frac{6+1}{2} \times 6 = 21 \]
Player starts with 4 cards in hand and draws one card each turn. Up to turn 6, 5 cards are drawn, which make 9 out of 12 cards from the deck accessed in total.
How to build the deck to harness maximal energy? That’s the uneasy question we would try to answer in this article with the help of numerical computation. Let’s answer the simpler question of ‘what not to do’ instead at this stage.
- Midas Curse
Imagine a deck made of 12 cards of 6 energy cost. Such deck always makes use only of 6/21 mana by playing 6 cost card in the last turn.
Decks having too high profile are inefficient during first turns.
- Poor Fucking Infantry Curse
At the opposite pole is the deck made only of 1 cost cards. Such deck always plays perfectly on curve during first 3 turns (6 mana), but then couldn’t put in more than 1 energy during last 3 turns (3 mana). Initial tempo gets completely cooled down, and deck offers exactly 9/21 energy every game.
Deck having too low profile results in hand depleted soon in the game, while low-cost topdecks play below the curve.
Energy (Mana) Curve Combinations
How many ways are there to build mana curve in Marvel Snap? The plausible answer to similar questions in most CCGs: ‘Great plenty, go touch the grass nerd’, doesn’t exactly work here, because numbers in Snap are really small. Let’s go step-by-step.
From combinatorics point of view, there are 12 slots in the deck and infinite number of cards at various cost to fill those. The number of possible energy curves is equal to number of combinations with repetition.
\[C_{decks}={{n+k-1}\choose n}={17\choose 12}=\textbf{6188}\]
, where ‘n’ is the number of cards in the deck and ‘k’ is the size of energy range (1-6). The proof behind the expression could be visualized as follows.
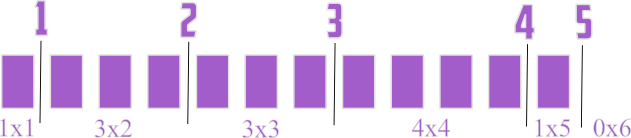
Building a Marvel Snap deck is equivalent to putting 12 bricks into containers numbered ‘1’-‘6’. There are 5 separators needed to divide the bricks into 6 groups. Each different order of separators with respect to bricks leads to a different combination, while internal ordering of bricks and separators is irrelevant (separators are not labeled). If we denote the number of bricks by ‘n’ and the number of containers by ‘k’, then there is ‘k-1’ separators and (n+k-1)! various orders of the system. Out of those n!*(k-1)! are duplicates. Consequently:
\[C_{set} = \frac{(n+k-1)!}{n!(k-1)!} = {{n+k-1}\choose n} \]
Number Of Unique Deals
Drawing cards in Marvel Snap is composed of two phases. First we draw the initial hand of 4 cards, where the order doesn’t matter. Then we draw one card every turn. Not a combination of 5 cards, but exact sequence is important there.
A conjunction of 4 initial draws combo with the sequence of 5 cards drawn later (permutation) would be called a deal. Outside the context of the energy curve (=all cards are distinguished), following number of deals is possible:
\[D_{all} = C(12,4) \times V(8,5) = \frac{V(12,9)}{4!} = \textbf{3 326 400}\]
, where C is the number of combinations and V is the number of variations. The expression on the right is an alternative view: 12 element on 9 slots variation, divided by permutations of 1-4 slots.
3 millions is a big enough number to provide some variety, but easily accessible for brute force machine analysis at the same time. If you build a deck, then strict test of its performance with respect to deals is possible as long as locations and opponent’s deal is ignored. It would never last longer than a minute.
In the context of energy curve, cards would obviously be distinguished only by the cost. The set of unique values will no longer contain exactly 12 elements, but 6 or less, depending on deck used. Elements could be repeated up to some limit equal to the number of cards at the given cost.
The deck mana curve would be denoted simply as a list: [n1,n2,n3,n4,n5,n6], starting from the no. of ones, ending up on the number of sixes. The most dispersed deck profile is [2,2,2,2,2,2]. Using this profile, there are 106 200 deals possible. This is a limit value; all other energy curves would have less deals.
100k is a value which invites crude direct numerical computation rather than even more primitive Monte Carlo methods used in more complex card games. If you could run Monte Carlo 100k times, you could as well exactly compute 100k possible scenarios. The ideal obviously would be smart approximations and closed-form solutions, so if you have come across any, let me know 😉
Important thing to note when going from unique cards to energy profile deals – some deals have higher multiplicity than others and are more probable.
Method
- Generating a set of energy curves. Constraints: n6 < 4, n5 <5, n4 < 7, n3<9 (could be more restrict, I prefered a big set).
- For each set generating the deals including multiplicities.
- Playing through each deal using a dedicated algorithm. Playing on curve whenever possible. Otherwise playing as close to curve as possible. If many possiblitiles, then choosing the one spending least number of cards. Algorithm is not optimized for later turns consquences of choices made.
- Registering energy used in each turn for each deal.
- Averaging the set of deals with weights equal to multiplicity to retrieve mana efficiency in turns and total score.
- Repeating steps 2-5 for each energy curve.
Results - Optimal Mana Curve
Finally some meat. I predicted that optimal energy curves would have more 1s than usual meta decks, because I assessed turn 1 efficiency as crucial. There is 33%/58%/75%/86% chance to find a starter in Turn 1 if playing 1/2/3/4 cost 1 cards (btw, Hypergeometric Calculator is a perfect tool to estimate those) . 1s are also very useful for closing the energy gap when playing other cards .
I expected the number of 6s to be no more than 1, the number of 5s to be exactly one or two. Let’s see if compuation confirms these predictions.
(data for over 3000 curves is accessible via ‘google sheet’ link under the table or here; conclusions below would also refer to this data)
Conclusions And Observations
- There is no Holy Grail amongst Energy Curves.
The differences in efficiency between reasonable curves are not substantial and draw RNG could easily turn the game in favor of one or another deck, no matter the average amount of mana spent in general case.
- Peak natural efficiency is 96.5%
You should expect to spend around 20 energy crystals during the game on average. One crystal would usually be wasted, but you cannot do better unless using other tools.
- Decks with 4x or more 1 cost cards are not the most efficient.
My prediction was wrong. The first curve with 4×1 cost cards took the 33rd place in the grand table (423210). Such decks apparently have flaws not only in the 6th (5.64) but also the second turn (1.70). There is not enough 1s to guarantee a pair, while deck could run too many 2s either in such case, or the profile would be too low.
- 2x or 3×1 is optimal
It is good to have a chance to find ‘1’ as opener or a helper to fill mana gap during later turns. 1s are still useful part of the deck, but running more than 3 is usually overinvestment.
- 2 cost cards are the secret of the perfect flow (!)
As could be seen in the chart, Top10 profiles run as much as 4x two cost cards on average. First build running 2x or less 2s took 28th position, with 1.58 efficiency in turn 2. Two cost cards are the backbone of fluent decks!
- The rule of 5 for 1s and 2s
There is not a single deck in Top100 of the rating with sum of 1s and 2s lower than 5. Optimal deck should always run at least 5x of ones and twos combined, while every profile in the Top10 contains at least 6.
- 3s are as important as 1s
With few exceptions, optimal decks never run less than 2x ones. Same truth obeys for 3s.
- 8/4 split
Cards up to 3 mana cost make up for at least 8 out of 12 cards of almost all decks in Top100 of the rating. 8/4 split between low and high energy cards is a good rule of thumb, while the most fluent decks even go 9/3.
- One 4 is a staple, two 4s are usually okay.
- One 5 is usually okay, two 5s are seldom, but acceptable.
- More than one 6 is a waste, it is fine to run a deck without a 6.
Closure
Of course, the observations and conclusions made above are not ultimate and hopefully will just provide guidelines for your own Marvel Snap knowledge and discoveries. The provided sheet is ready for your exploration. Don’t expect miracles; optimizing the energy curve wouldn’t bring you a big edge, especially against meta decks which are already optimized with extensive ‘trial and error’ method.
Stay tuned!