

Introduction
Let’s continue the analysis of the three slots resource allocation game as introduced in the preceeding ‘A Three Slots Resource Allocation Study Definitely Not In Marvel Snap‘ article. We have approached the problem in a ‘Human’ way – made basic observations on three slots game properties, found elementary strategies and assessed their matchups.
We established ‘Basic Killer’ strategy to counter the most schematic gameplans. We predicted ‘One-Out’ and ‘Basic Killer’ strategies to be a decent choice overall. Now is the time of the trial by fire! The ‘Machine’ will validate our ‘Human’ judgement.
Computation Method
- Brute force numerical computation.
- 60 money bags, 3 slots.
- Finding all partitions of 60 into 3 (331 shapes).
- Computing matchups of each two shapes against each other.
- Total winrate of a shape (strategy) is an average over all matchups (assuming equal probability of each shape from opponent).
- Crossing out weakest strategies (winrate lower than threshold; here 50%) and repeating the averaging procedure until only last strategies of equal mutual winrate remain (feedback optimization).
Method Properties
Presented method is probably the most straightforward and simplest approach to strike the problem. If you know about more refined, strict mathematical tools solving the problem, let me know. I was just too lazy to even try finding strict solution 😉
The sample is finite, but big enough to derive general conclusions. 60 is no accident – it divides by crucial 2, 3 and 6 integers (check out the preceeding article).
Given the set of the initial parameters (number of bags, slots, cut-off threshold from the last step of the procedure), same result is always achieved. At each feedback optimization loop, different strategies are performing best.
The first estimation assumes a completely random choice from opponent, and each subsequent one assumes more refined pick from opponent (random one from the peeled set). A characteristic property of this feedback optimization method is that the objectively best counter to the current set might have been cut-off at one of the preceeding steps.
Results
- Whole Space (Random Opponent’s Pick)
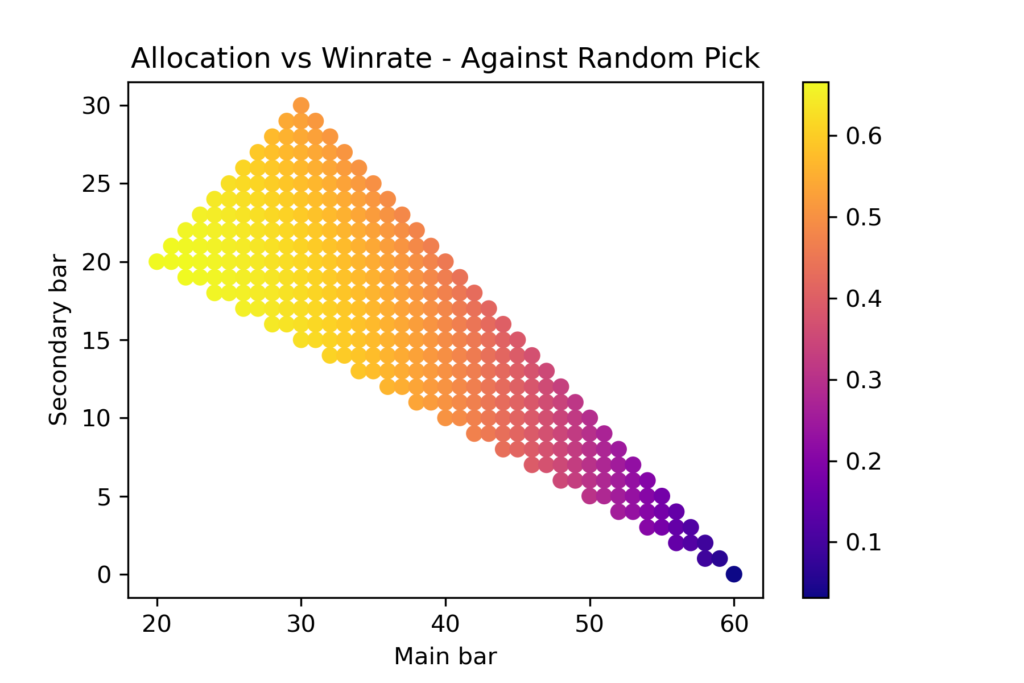
Surprise! Against opponent picking a random resource spread, uniform resource distribition proves to be the most efficient strategy! The probability of win in such case is equal to 2/3; two out of three games would be won.
That’s the region where machine is clearly superior to human’s assessment from the preceeding article. Picking possibilities one by one and evaluating matchups, machine provides clear, undisputable answer. Have Human completely failed? Let’s move on to next iterations.
- 2nd Iteration
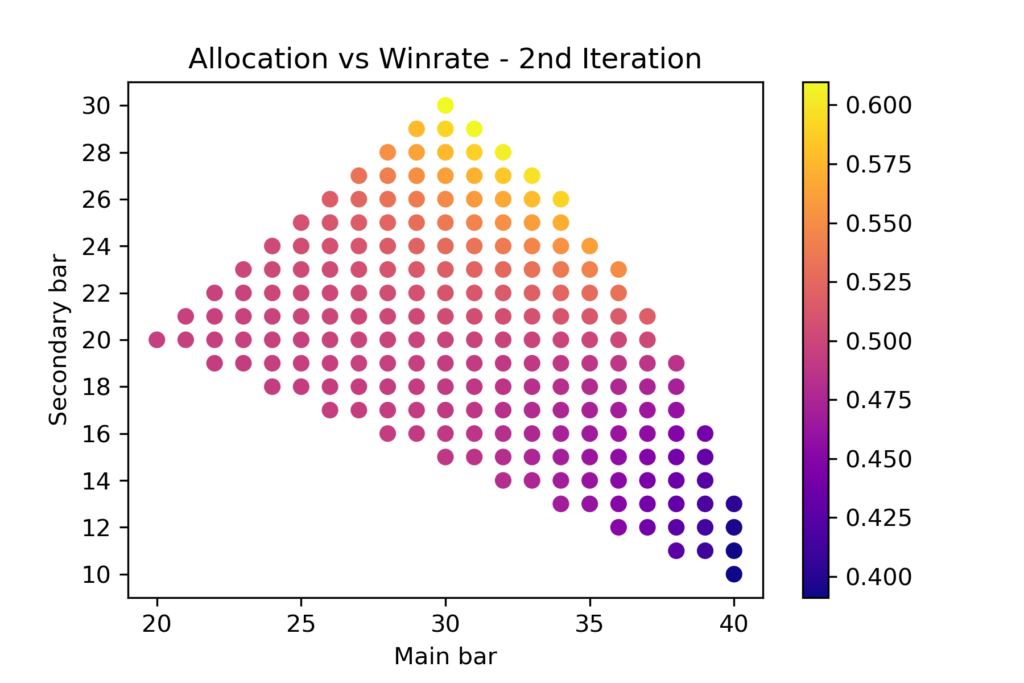
Just one iteration – cutting off the worst overall strategy outliers – is enough to move from ‘Even’ to ‘One-Out’ as the most efficient strategy. In fact the perfect ‘One-Out’ tops the winrate chart with 61%.
It is understandable – ‘Even’ vs ‘Mono’ matchup was better than ‘One-Out’ vs ‘Mono’. After very bad ‘Mono’ strategies got cut off from the sample, ‘Even’ type started to be the most represented. ‘One-Out’ is a perfect counter to the most abundant mode and therefore tops efficiency chart.
- 5th Iteration
At the 3rd iteration, ‘One-Out’ potential reaches peak value: 65% winrate, almost as good as ‘Even’ versus completely random opponent strategies. Then at 4th, ‘One-Out still leads, but the drop is rapid – below 60%. 5th Iteration is the moment when chart leader changes.
As we could see, mixed modes take over. Are these random modes? No. The 1st bar is over 1/2, the 2nd over 1/3. The ‘Basic Killer’ strategy! After 5th iteration (and one second of cpu time…), the machine arrives at the same conclusions on late meta as Human. ‘Basic Killer’ is not a fictional villain – it is a real character spotted by the Machine, with a confirmed kill rate.
- Final Iteration (7th)
Only two contestants survive all the iterations. Both are of mixed type – the first is a ‘basic killer’ and the leader after 5th iteration, the second has main bar exactly at 1/2 and is more of a counter to ‘basic killers’ than ‘one-out’ mode. In fact, ‘One-Out’ drops from the chart at 6th iteration, and 30-27-3 becomes the leader right then.
Very late iterations, like the final one, are not very useful in practice; the space of possibilities considered by opponent is surely greater than just two options.
Basic Conclusions
- Machine reproduced Human idea of ‘basic killer’ in the late meta (check out the preceeding article if you haven’t done it yet)
- There is no single best strategy; even 20-20-20 spread is best against random picks (first iteration), one-out 30-30-0 is the best pick against players with tendency to distribute resources evenly, ‘basic killer’ is a late meta strategy, good against players who just discovered the power of ‘one-out’.
- Each iteration is a close analogy to meta evolution in card games; strategies left out at early stage may come back as ‘metabreakers’ against finely tuned late meta builds.
- There is a 66% chance to win against a random picking opponent when using ‘even’ distribution. ‘One-out’ also has a decent edge over mainstream at early stages of meta evolution.
Closure
Hope you enjoyed this short numerical detour and the results brought you lots of inspiration, both for gambling and striking real life problems.
At this point we could treat the topic of single turn allocation as closed, but more Marvel Snap inspired mathematical content will keep coming. Stay tuned!