

Introduction
In the recent Understanding Gwent Pro Ladder MMR System article we’ve built step-by-step an ELO rating system starting from basic assumptions. We recognised that it reproduces most of Gwent Pro Ladder MMR system characterstics perfectly well.
Consequently, we know a lot about statics of the rating system: what differences in MMR ratings exactly mean, what are MMR gains/drops in each game depending on players ratings etc. On the other hand, the dynamics remain an unknown land we have to explore yet. For example: how long does it take for a 2700 player to achive his real rating starting from 2400?
In this article we would use a simple Markov Chain model to investigate basic qualitative effects in ELO systems in general. Then we would move to Gwent examples. Have a good read!
Model
Assumptions:
- Ladder is in the equilibrium state but for one analyzed player who climbs from starting ELO.
- Climbing player is always matched with opponent at the exact same current ELO level.
- There is infinte number of players at each rating available, opponent’s ratings are not updated.
- Analyzed player skill remains constant and is expressed by equilibrium ELO level.
- Draws are not considered
The list stated above leads to very straightforward transition diagram, where each node represents current ELO(MMR) level, and K is the k-factor used in particular rating system. Consequently, we could present the system as a Transition Diagram:
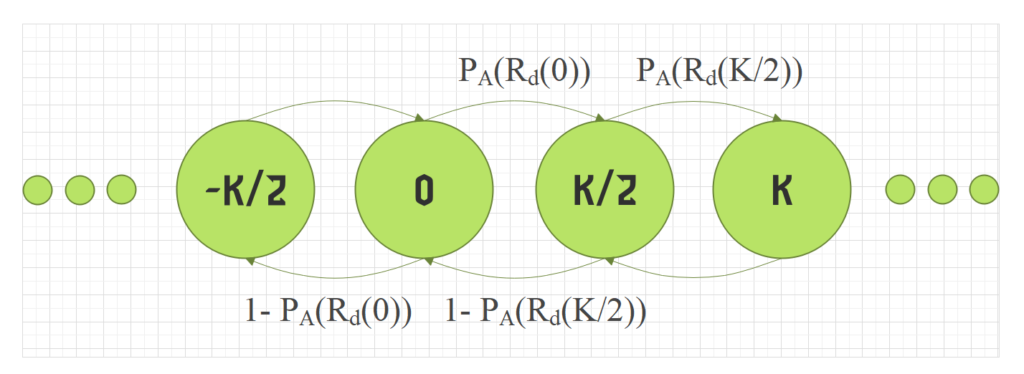
For the sake of abbreviation, lets call analysed player A. In the diagram above (…-k/2, 0, k/2, k,…) denote current ELO of A. Obviously, we can change the starting point from 0 to 2400 without any impact on results. The arrows represent possible transitions after a game is played on particular node. The expressions next to arrows describe transition probabilty
\(P_A(R_d(X))\) – probability of Player A winning as a function of equilibrium rating difference \(R_d\) vs opponent rated at \(X\) = current player A rating
Markov chain
The process of climbing under these assumptions is a Markov chain – a sequence of events (0,1,2,3,4…) where N-th event probablity depends solely on the event occured in N-1 slot.
We won’t dive into more theory here, i’d only say that Markov chains and Transition Diagrams are pretty useful in modelling of various processes.
Computing
In the model presented here a great deal of quantities could be computed, depending on what question we ask. Systems of this kind are very often simulated by means of Monte Carlo techniques, where a Markov chain/set of chains is generated and various quantities computed by averaging.
Luckily, whenever the transition diagram could be handled by computer at least in the most important part, there are better and more accurate approaches. Transition diagram could be translated to transition matrix and a set of linear equations will lead to accurate numerical result.
For example we would calculate the mean time of reaching rating X. It is possible thanks to a set of linear equations coupling mean times of reaching various nodes with each other.
For comparison, getting average mean time for one of our friends from Gwent Monkey Threshold (1,2) reaching 2600 with MC methods could be a bit troublesome with f*** monkey exploring 2100 region rather than climbing up after 20 billion steps (in fact it could be shown that expected time for a monkey to make just one step in the right direction is equal to… infinity).
Transition diagram used in this simulation was cut down to (2300 – 2800) MMR range.
Results
As mentioned in the section below, expected times always include worst scenarios, which in the case of ladder climb could be really painful. For example having 60% to win a game and being on peak you may think of expected time of improvement as around 1.5 game.
But it isn’t true – a single loss means elongating the path at least to 3 games, 2 losses = 5 games and so on. Unfortunate scenarios are usually neglected in practice – Gwent players are optimists in general :). For the sake of simplest possible demonstration, a result for constant winrate and (2300-2800) MMR range will follow here.
In the constant winrate model current MMR rating doesn’t matter, therefore the expected times for any longer climb could be obtained simply by multiplying the time to improve score; 1 game below peak means 2 times longer improvement path and so on.
On the other hand, on the ELO path, the time to improve would vary with current rating. The higher the rating, the harder it is to improve. Let’s observe this effect on a 2700 skilled player.
As could be seen, the expected time of improvement grows exponentially during climb. Note that ELO system implies that 2400-2500 saturation path for 2500 skilled player is identical to 2600-2700 in the picture. Similarly 2500-2700 is identical with 2400-2600 for a 2600 skilled player. We have many plots in one here!
Summing the expected improvement times on the path it is possible to assess the total time of any climb.
It is hard to find a better demonstation of why pro Gwent players like Pajabol tend to meme only in the first part of the season. If you are certain about your skill level, the price of losing a game at low MMR ratings is very low. A cost of a loss is lower than 4 games on average around 2.4k in the picture.
On the other hand, a loss while being on the equilibrium peak is worth 24 games (no matter your skill level!). If your skill is around 50%, then the very first games of the season already have overnormous impact on the final score. If you climbed to Pro for the first time and rating scores are important for you – don’t start with memes or testing stuff out, but play meta and try to assess how good you are!
Lot of information could be derived from the graph above. Maybe just another rule of thumb: climbing ~40 MMR above your equilibrium rating takes roughly the same time as achieving equilibirum! Let’s now compare how many games are needed to reach various milestones depending on your real strength.
Monkeys out? Not really – as we said earlier, the math of expected value is very peculiar here. One unfortunate monkey outweights hundreds of pretty successful mammals, so GMT2 still obeys in practice.
Closure
That would be enough for now. We explored the world of expected times, but the transition diagram offers way more spicy data. To be continued in the future.
One final remark. ELO rating is not absolute – it is always relative to the players pool. To get clearly what I mean, imagine that just Top4 players instead of 500 remains on Pro Ladder after season. Would their ELO rating be like 2650 in this 4 players group? Obviously not! Everyone probably would staturate somewhere around 2400.
It is you dear not-so-successful player who make them reach MMR highscores! Moreover, during the Pro Ladder season you could improve you imaginary ELO a lot by studying the game, but… just waiting also works! It is due to MMR inflation effects, you could read more about it in my old simul study.
Thanks for reading! ‘Phasing’ and ‘Nullifying’ incoming. Then I’d publish actual gameplay Gwent content if something worthy appears during Pro Ladder prep. Stay tuned!